
Sustainability Report 2025
Key Performance Indicators of the KMG Group
Production indicators
Oil and Gas Production
Oil and condensate (thousand tonnes)
Natural and associated gas (million m3)
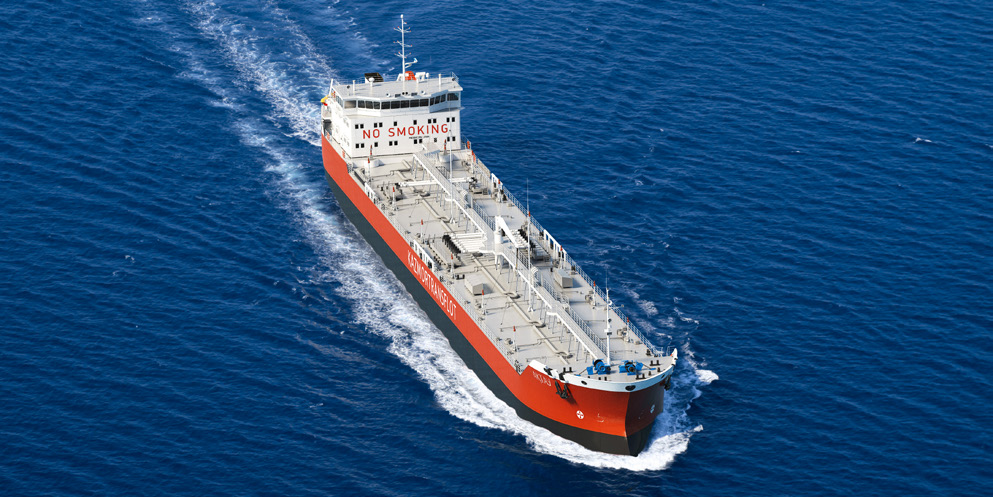
Oil Transportation
Volume of mainline and marine transportation (KMG’s share), (thousand tonnes)
Pipeline transportation (KMG’s share) (thousand tonnes)
Marine transportation (KMG’s share) (thousand tonnes)
Freight turnover of crude oil (million tonne*km)
Refining and Marketing
Oil refining (thousand tonnes)
Production of oil products (thousand tonnes)
Wholesale sales of KMG oil products produced in Kazakhstan (thousand tonnes)


SERVICES
- Ground transportation, including cargo and passenger transportation and field transport support services
- Offshore operations support
- Oil and gas wells drilling and development
- Underground and major well repairs
- Production of oilfield equipment
- Automation of technological processes
- Technical maintenance of measurement instruments, automation and telemechanics systems; telecommunications, radio and cable/satellite communication services at oilfields; inspection and repair of measurement systems; maintenance of emergency communication systems
- Oil spill response services
- Extraction and transportation of drinking water; provision of seawater transportation
- Catering and maintenance services for social facilities, etc.


Sustainable Development Indicators
Environmental Responsibility:
Energy saving (thousand GJ)
Water withdrawal volume (million m3)
Greenhouse gas emissions (Scope 1)
(million tonnes of CO2)
Volume of utilized historical waste
(thousand tonnes)
Associated petroleum gas
utilization rate (%)
Economic Responsibility:
Profit (KZT billion)
Taxes (KZT billion)
Procurement volume (KZT billion)
Share of in country value in procurement (%)
1 The consolidated volume of oil transportation takes into account the transportation volume of each individual pipeline company based on KMG’s operating share (excluding KazTransOil JSC). A portion of oil volumes may be transported by two or three pipeline companies and, accordingly, these volumes are counted more than once in the consolidated oil transportation volume.
2 The freight turnover of crude oil for each individual pipeline company is calculated based on KMG’s operating share (excluding KazTransOil JSC).
3 The volume of wholesale sales of KMG’s own oil products produced in Kazakhstan increased by 6.4% compared to 2024 and amounted to 5,607 thousand tonnes, of which 5,113 thousand tonnes were sold on the domestic market and 495 thousand tonnes were exported.
4 Taxes and other mandatory payments to the state budget
5 Volume of goods, works and services supplied across the KMG Group